Getting Started with FAIR

Tips for biologists who want to improve their data skills
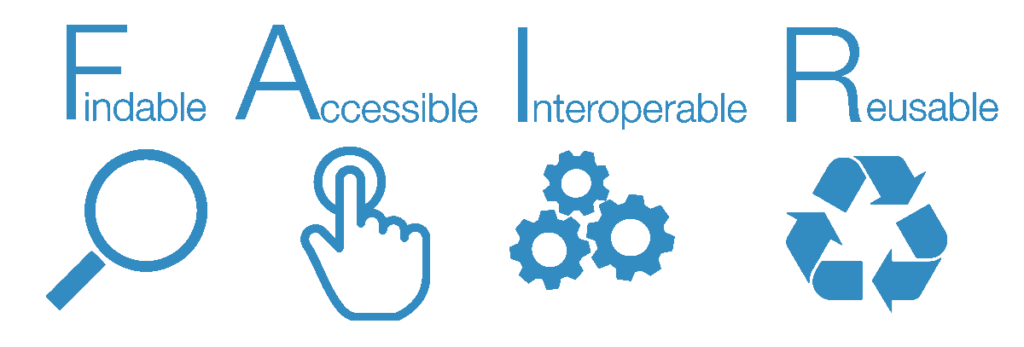
Biologists can play a key role in implementing FAIR (Findable, Accessible, Interoperable and Resusable) data – here are easy steps to get started!
During the last three years learning to work with bioassay data in Tableau I’ve made a lot of mistakes. All too often I’ve cut corners to get to the fun part – the creation of interesting visualizations and stories. Visualizations that can help biological researchers explore and understand phenotypic assay data. One of the lessons I’ve learned is to play more attention to the basics of data management. This is an area that biologists tend to avoid when possible but really should embrace. Below we describe three steps that biologists can follow to improve their data stewardship. These recommendations promote FAIR principles and are foundational to good data science.
The Need for Data Skills and FAIR Data
Given the deluge of data coming out of life sciences research, it’s more important than ever for biologists to improve their data skills. Biologists are the domain experts who know what questions to ask and how to interpret results. They understand the technical limitations and underlying assumptions of their experiments. Helping biologists get better at working with data will speed the pace of research. Research advances when results are integrated across research groups and experiments. Data integration, in turn, is facilitated when data are FAIR (Findable, Accessible, Interoperable and Resusable).

Image by SangyaPundir
Here we suggest three easy steps for biologists to take to support FAIR data. These are primarily aimed at biologists creating small to medium sized bioassay data sets. These steps reflect good data stewardship practices that are foundational in data science but require no special tools or skills (other than spreadsheets). If you are fortunate enough to be working with data scientists, they will appreciate your efforts to follow these! We suggest applying these practices to published datasets (e.g., published in supplementary tables or posted on figshare) to make your data more accessible and understandable.
#1 Prepare your data in a TIDY DATA format
Tidy data is a format for data that facilitates analysis by computer programs. Tidy data is organized in a rectangular structure where each variable has its own column and each observation has its own row (Wickham, 2014). We love this illustrated article by Julie Lowndes and Allison Horst from Openscapes explaining what tidy data is and why it is important for supporting data science and FAIR principles. Note that while most of our data visualizations appear in so-called wide formats, we keep the underlying data tidy.
#2 Create a DATA DICTIONARY for your project
A data dictionary is simply a table of terms and definitions used for your data analysis project. Data dictionaries include a list and description of the column headers from your data table. They can also include fields that are generated during data analysis (for example, calculated fields such as mean and standard deviation, the method for hit calling, etc.). In our data dictionaries we also include field headers for any annotation terms or metadata used in the analysis (see below). Keeping a data dictionary along with the data table for each analysis (e.g., figure in a paper or interactive dashboard) makes the data more accessible to others. It helps other researchers do independent analyses and/or combine your results with their own data. Downstream data analysis is much easier if terms are standardized, so be consistent in your use of terms and use standard ontologies when possible (see below).
#3 Create METADATA TABLES (Assay Information or Compound Information Tables)
Metadata are external information about the experimental components (e.g., assays or test compounds, etc.). Metadata, such as target class or biological category, may be used in the analysis or to simply annotate a data visualization to improve understanding. Check out our case study on “Assay Validation Using Chemical Probes” to see how metadata about the probes and their target pathways can be viewed by hovering over the pathways in the bubble map.
Given the universe of metadata that COULD be connected to an experiment, one of the most important contributions that biologists with domain expertise can make is to identify (and curate!) the key metadata. This is the prioritized information that is necessary to answer the key scientific questions and effectively communicate the results. Your data science colleagues rely on you for this.
Using defined ontologies and registries for metadata is the best way to support FAIR data practices. Registries for drugs such as the FDA’s Global Substance Registration System), the use of SMILE strings (Gilson, 2014) and BAO ontologies, are all ways to promote data interoperability and reuse.
Every biologist going to the trouble of designing and executing experiments wants their data to matter. Following these guidelines will help make research data more accessible and interpretable to other scientists. Learn more about FAIR here.
Photo by Allan Rodrigues on Unsplash.


